Issue with solar tracking model

Hello guys, I’m facing some problems while trying to running solar PV simulations with 2-axis tracking.

Weirdly, I’m getting the same capacity factor results while running simulations with 2-axis tracking and without tracking (for coordinates LAT : -22,9483 LON : -67,4725 )

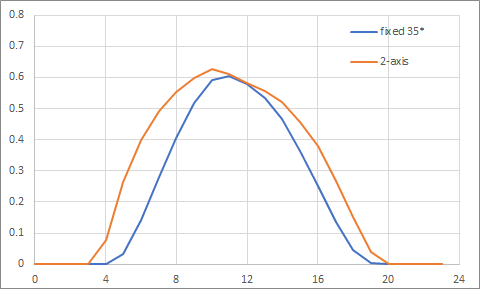
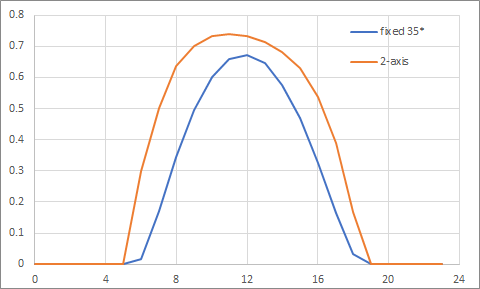
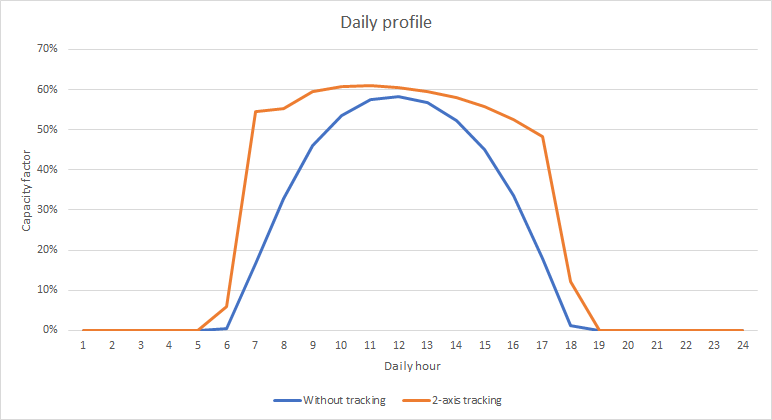
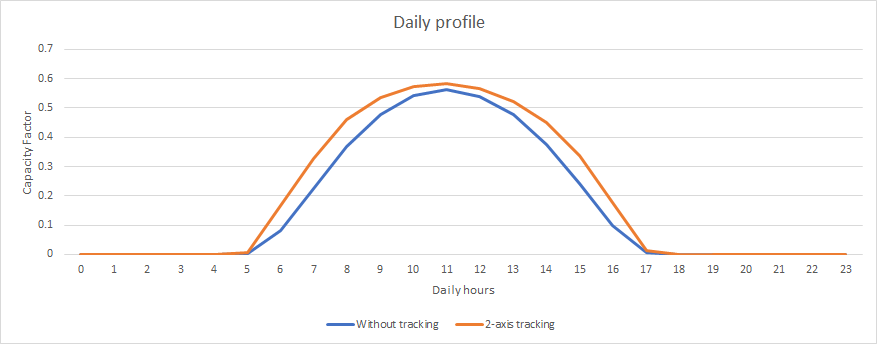
In addition, for LAT: 10,3906 LON : -86,6169, the mean capacity factor is, indeed, different. But looking at the daily profile, it looks like the 2-axis tracking profile is not “squared” enough, I mean, it is very similar to the simulation without tracking, and I would expect that the curves were much more different (please, see figure below). All simulations were ran with tilt angle = 0.

Is there any explanation for this?

Thanks in advance,
Taina

Hi Taina,

I have run a couple of trials and wonder if this is down to how high the solar insolation is at your location? A 2-axis tracker yields a very rounded daily profile in the UK (see the top chart). But, a 2-axis tracker in northern Australia looks more squared off.


UK average diurnal profile during July:

image


Australian average diurnal profile during January:

image


Does that help explain what you’re seeing? I wonder if using the 0 degree tilt would make the effect stronger for you?

Kind regards,
Iain

Hi Iain, thanks for the fast reply

I’m not sure if it depends on the solar insolation, because, in my experience, solar plants with 2-axis tracking generate output profiles with clearly squared forms.

So I was testing your PV API (github.com/renewables-ninja/gsee) and got different results for 2-axis tracking for the same coordinates LAT: 10,3906 LON : -86,6169 (see figure below)

This result totally make sense to me. But now I can’t understand the difference between the API and the result from the main interface (https://www.renewables.ninja/).

Could you help me with that, please?

Thanks!