I studied the power curve of the Enercon (and other turbines). The power curve should look something like this: https://www.enercon.de/fileadmin/Redakteur/Produkte/e-126/LK_E-126_7580kW_de.png
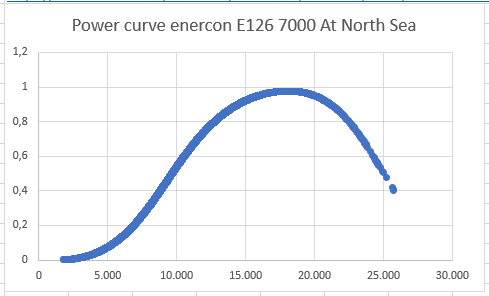
However when I download the date in Excel and perform a scatter I do not see such a curve?
Does anyone know why the power output goes down >18 m/s and not forming a flat line till 25 m/s as in the power curve on the Enercon website?